What did we cover?
In last week’s data collection orientated lesson, we learned how to present and gather insights from raw data. Once we have these insights into the current situation, we can then use them in forecasting; this blog discusses the benefits of forecasting in marketing.
Managing and presenting data/ insights
You could go to the effort to create the best research project in the world, but if you don’t know how to present this data properly then it really has no value. Your marketing research should lead to results and recommendations.
Instantaneous data is becoming more apparent as we look at data that is drawn in from online sources such as surveys. In this case the person who set up the report might choose to have instant alerts meaning that once a recipient has completed the survey a direct email is sent to the creator.
Benefits of forecasting
Forecasting is what we are able to complete after we have collected the data and research. But why exactly is it so important to marketers?
Forecasting gives us the upper hand as it can identify opportunities and potential threats. The sooner we identify these, the sooner we can begin to create tactics that can be implemented to achieve better results. Looking at forecasted events will allow us to explore trends in the market, and how we can use them in what we do.
Previous forecasting of say, future costs and trend predictions allow us to refer back and think about how accurate we were. We can compare our current situation to how we forecasted it to be. Analysing how accurate we were can help us improve how we forecast in the future.
If we do our research at the right time and begin acting on it then we’ll keep a competitive advantage over our competition. This way forward thinking will help us to maintain a good public image, be on top of our game, serve the right product in the right place and at the right time; and also bring more money to the table.
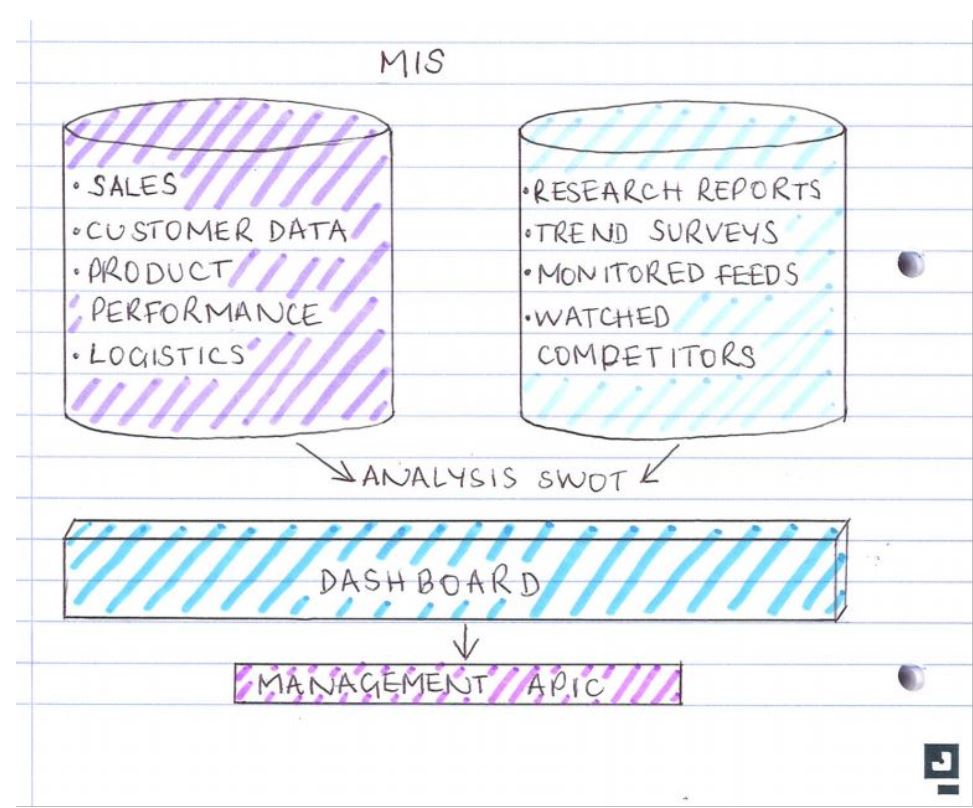
The marketing information system (MKIS or MIS)
The MIS is a ‘system in which marketing is formally shared, stored, analysed, and distributed to managers in accordance with their informational needs, on a regular basis.’ Jobber, 2007. Maybe you haven’t heard of this before and it might be because your company doesn’t haven one in place, don’t worry because most companies don’t! The idea is that companies input the information in the diagram below into a collaborative dashboard that people can easily view and gain insights from.
What makes data valuable?
The value of the information can be demonstrated by the following characteristics:
- Completeness
- Accuracy
- Relevance
- Clarity
- Timeliness
These few checks on your information can distinguish whether it’s going to add value to your decision making or not, the key is not to rely on your information unless you believe it’s ticked all the boxed above.